Luciad V2016 Puts Users at the Center of Technical Innovation
Luciad celebrated the launch of its version 2016 suite of geospatial software components.

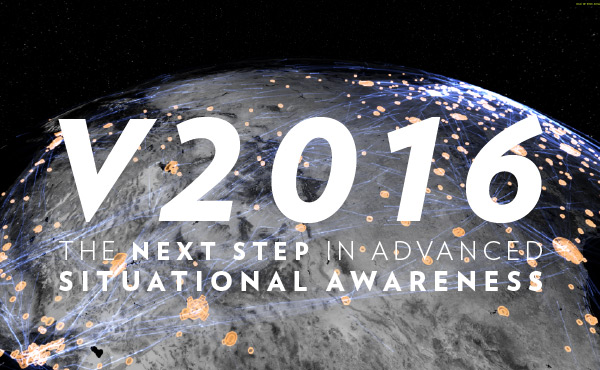
The release includes the 3-D browser technology behind the web app that the company launched in October 2015. The app showcases Luciad’s capacity to track large amounts of moving data – in this case 35,000 global flights – and has been viewed by nearly 50,000 people since its launch in October 2015.
“V2016 packs a lot of technical innovation,” said Luciad Chief Technology Officer Frank Suykens. “We have introduced the only single API web solution that allows developers to support 2D Canvas, 2D WebGL, and 3D WebGL visualization with the same code."
“We’ve also put a lot of emphasis on visual analytics and user experience, which means that developers can create really beautiful applications for their end users that will allow them to easily make sense of their big data.”
The V2016 product suite also follows the company’s roadmap, which is focused on four main pillars: 3-D in the browser, developer and user experience, data and application integration and visual analytics.
3-D in the Browser
The release brings Luciad’s powerful 2-D, 3-D and 4-D visualization and analysis capabilities to the web with LuciadRIA 3D, a pure HTML5, WebGL solution.
Developer and User Experience
Luciad continues to deliver consistent, user-friendly experience and upgraded its Lucy component within LuciadLightspeed to provide users with an intuitive, map-centric user interface. LuciadLightspeed now adapts to user devices to ensure smooth operation on less powerful tablets and mobile devices. V2016 also allows users to easily integrate their Luciad applications in Maven development projects.
Data and Application Integration
The latest release of LuciadLightspeed includes support for Oculus to immerse users in a virtual reality (VR) experience. It also includes support for ERDAS Imagine and Geospatial Data Abstraction Library (GDAL) raster formats.
Visual Analytics
V2016 also delivers a number of visual analytics functionalities like clustering, as well as features to fuse, serve, and compare multi-spectral imagery and multi-dimensional raster data, like NetCDF weather data.
Download New Feature Documents for More Information


.jpg)


.png)

Comments
There are no comments yet for this item
Join the discussion