Software operating as Java applet in frames of common internet browser displays actual, archived or simulated radar situation. The form of the presentation is the same as it is presented to ATCOs inclusive radar maps, radar target legends, filters and other information. Server part, created in Java language, is absolutely independent from HW and OS.

 For more about CS Soft Ltd. and its products see www.cs-soft.eu
 - Easy start-up with no necessity of the installation Applet is automatically loaded into web browser. All common internet browser are supported - Firefox, Explorer, Mozilla etc.
- Transparent display Application is analogy to ATCO's radar data presentation.
- OS and HW independence Both client and server parts are created in JAVA programming language - total independence from OS a HW
- Automatic radar data archiving Radar data are automatically archiving on the server for coming playback
- Possibility to playback archived data Data playback on the client workstations is possible in the speeds 25% to 400%
- Different categories Asterix format support Currently 30 and 62 categories are supported, others adding is easy due to open architecture
- very easy installation
- low costs on HW
- HW a OS independence
- archiving and playback of recorded radar data
- radar data support in Asterix format - different categories
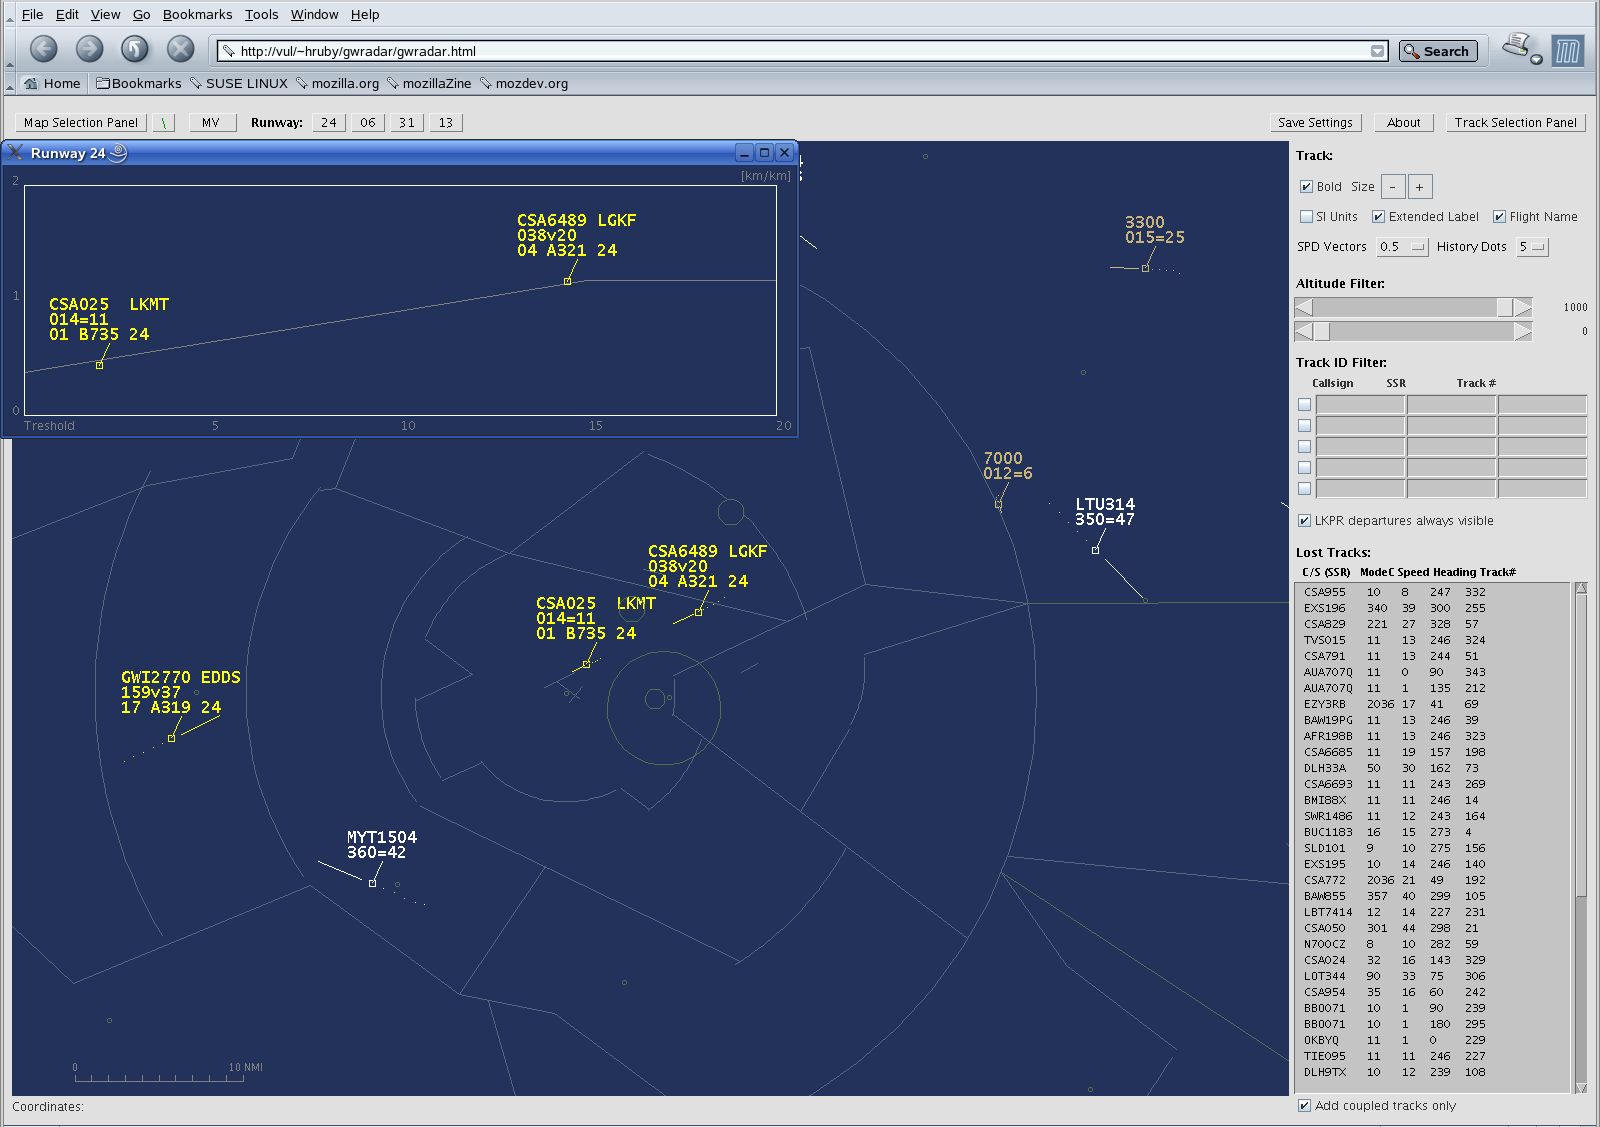
Above you can see the illustration of WEB browser window with jRadar viewer applet running which provides you with more details. Radar window screen is the main part of display. In upper part (above the radar window) is always visible toolbar. At the left of the display is located map selector panel with additional buttons for position control and radar window display scale. Right side of the radar window there is a panel for radar window appearance settings, track filtering table, and radar lost targets window.
For correct display of all key controls and monitoring components it is recommended to use at least 1280x768 pixels display resolution.
If the browser window will be resized to smaller, some less important information will be hidden. At the left of the radar window, number of lines at Map selector section is getting smaller if the vertical resolution is reduced. At the right of the radar window, number of lines in the lost tracks table will be reduced, if the window will be resized smaller. Another possible place for saving in right panel is number of lines in track filtering table. It is possible to do that using applet starting parameters. If horizontal size of the browser window will be resized to smaller, the radar window size is getting smaller too, and the upper toolbar will reduce the unused space.
It is also possible to hide both sides panels, thanks to this the radar window screen area will increase.
In the radar window, radar maps are displayed on the background and radar targets are displayed on top of it. As mentioned above, radar window size can be enlarged closing sides panels Map selection panel and Track selection panel. The radar window will then appear as displayed in the picture below. Format of radars data display is similar to other Air Situation Display systems. Radar track position is marked by a small square object, previous positions are marked by history dots, actual speed is indicated by speed vector lines and track information is displayed in accompanying track leader and label. Control of the display is described in later chapters.
Actual cursor location in map is displayed by geographical coordinates of longitude and latitude in left of status bar line, which is located below the radar window.


.png)


.jpg)
